In light of recent events, the US is no longer a viable business partner for the EU and we should be careful about whom we trust with our data. That said, this was not my concern when I started to look for a replacement for Slack and Teams a couple of months ago.
We write everything into Slack and Teams. If you search, you will find every business decision and every business strategy in our chat logs. Our chat data is extremely sensitive. That is why it scares me when Slack Inc. and Microsoft deploy AI models in these services.
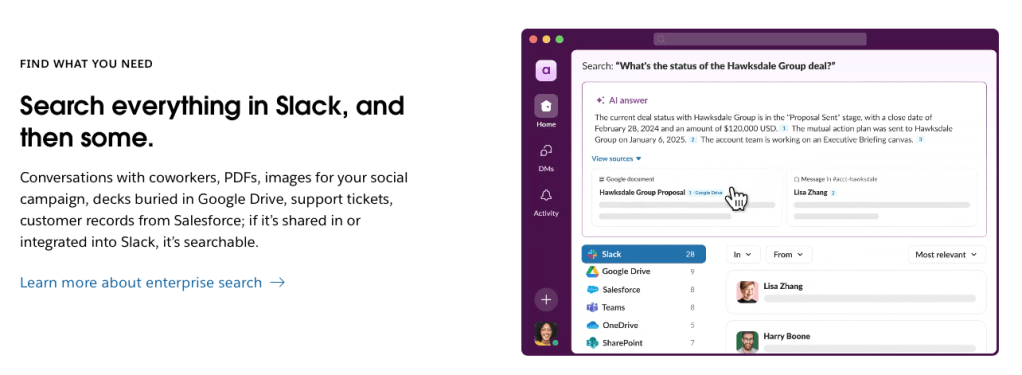
The privacy track record for AI has not been great, and very little is needed to prompt-engineer these bots into spilling the beans and starting summarize company secrets. What I want is an unintelligent™️ chat platform with a strong privacy focus – where I own the data and control what happens to it.
Matrix
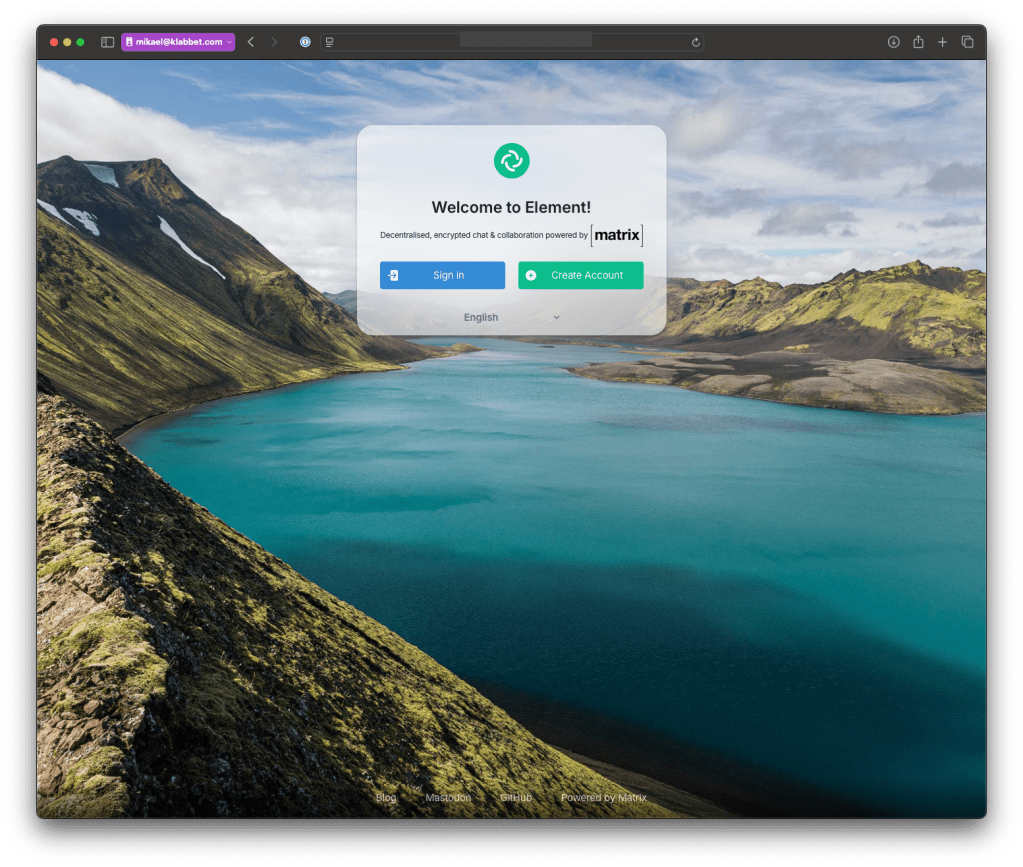
What I found is Matrix, which is a protocol and not a product. This means there is a plethora of servers and clients that can communicate over Matrix. I tested this by installing the Synapse server and using the Element web and macOS clients, as well as the Element X client on iOS.
This gives me a chat experience very much like Slack used to be. I had not realized how bloated Slack has become, and my Matrix installation covers about 90% of my needs.
You get a server where you can create spaces. Think of them as teams in Microsoft Teams. We could create spaces for each department or each project if a project includes enough people to warrant a whole space.
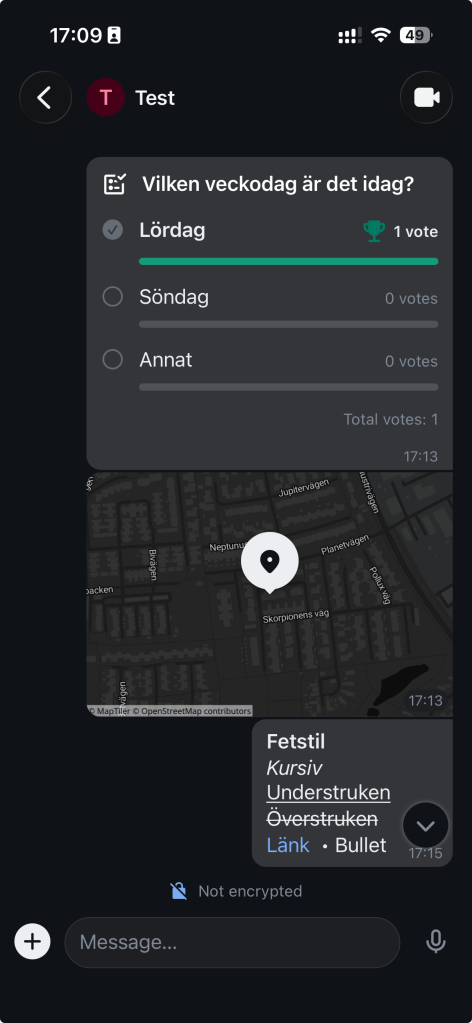
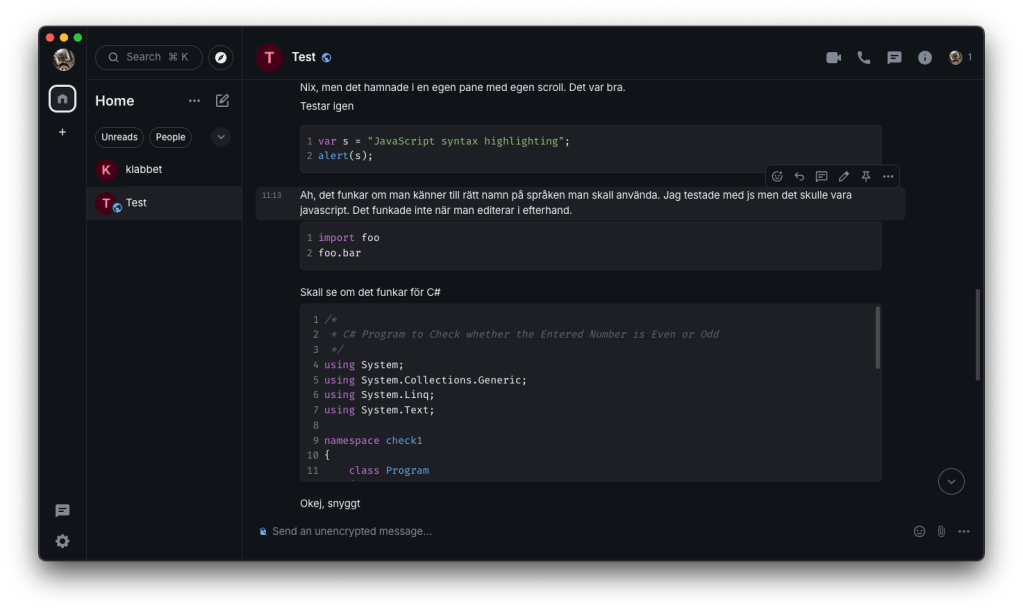
Within a space, you create channels. These can be public or private just like in Slack, and the chat is simply a timeline of messages. You can do the usual things: text formatting, upload media, insert code blocks with syntax highlighting, add polls, respond in threads or use quote reply.
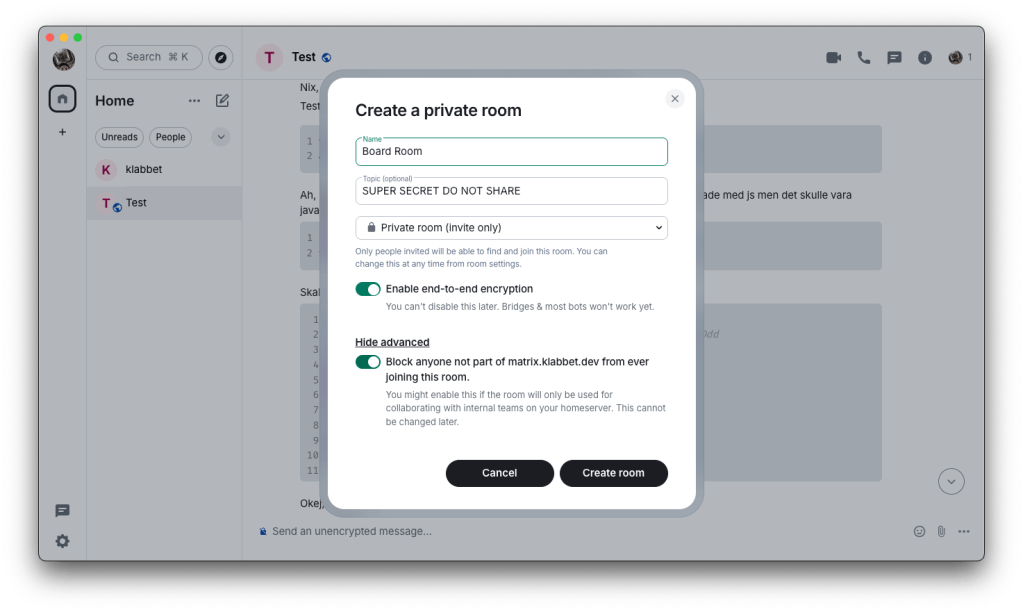
One feature I really like is when you DM someone or create a private channel, the chat is end-to-end encrypted. This means messages are encrypted on the server and only decrypted on the client. If someone joins the chat later, they cannot read previous messages because their public key was not included in the discussion.
I really like this. It means that even if the database is leaked, our chat logs are safe.
Even if your Matrix is set up as an isolated island, it can still communicate with other Matrix servers if you know the address. So you can chat with users on other Matrix servers. This might not sound special if you’re used to communicating across organizations in Slack or Teams, but remember those are still the same SaaS product. With Matrix, you communicate instance to instance, which I find pretty neat.
The Bad
Matrix is not plug-and-play. Heck, there isn’t even a “one-solution” install. To get started, you first need to research what server you want, which clients to support, how you want to authenticate users, and so on. And once you’ve done all that, installation is no easy feat.
Once installed, you also take on all the usual self-hosting headaches. You need to maintain the solution, secure it, ensure it has enough resources, and keep it updated. This takes time from your precious engineers.
And time is money.
It took me 40 hours to get everything up and running, and I estimate it will require about 4 hours per month to keep it updated. Hosting costs around $50 per month for two users. The server capacity should be enough for roughly 20 users.
After using it actively with my friend for a week I have no complaints about the functionality. Sometimes it feels a bit hacky, as open-source software sometimes does, but everything works and I haven’t encountered any bugs. Even on the cheapest compute option, the system is very fast and responsive.
Summary
Is Matrix a platform that everyone should immediately switch to? Maybe not. It depends on how you value the privacy of your chat logs. If it’s important that you own your data and control how it is stored, backed up, and secured, then Matrix could be a solution for you.
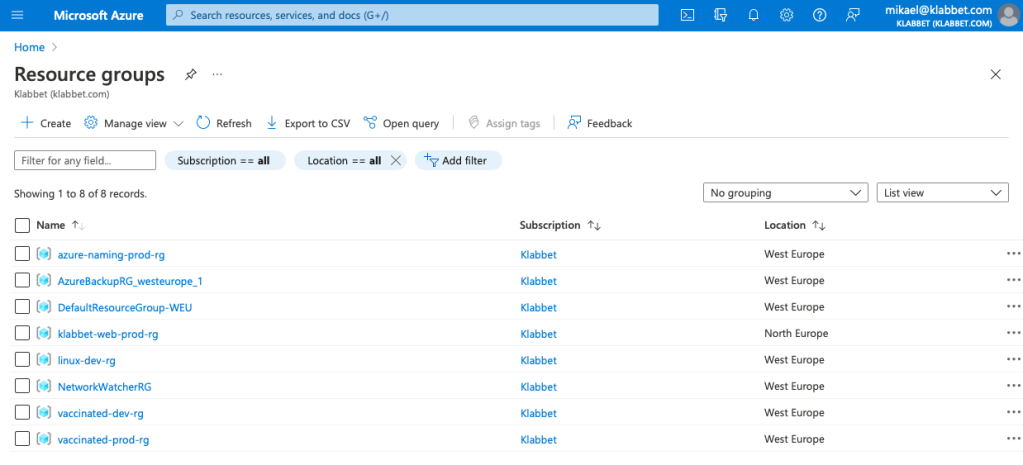
If you’re based in the EU, I would definitely consider it. Putting all your data in the hands of US tech giants might not be sustainable in the long run. With Matrix, you can host the database and the entire solution within the EU. You control that none of your data is used to train AI, and you secure it within your own network.
This is worth a lot in today’s landscape, and should be worth the cost for a medium to large company.
Installing Matrix on your own infrastructure is not for the faint-hearted. In my next blog post, I’ll document my experience and the pitfalls I encountered.