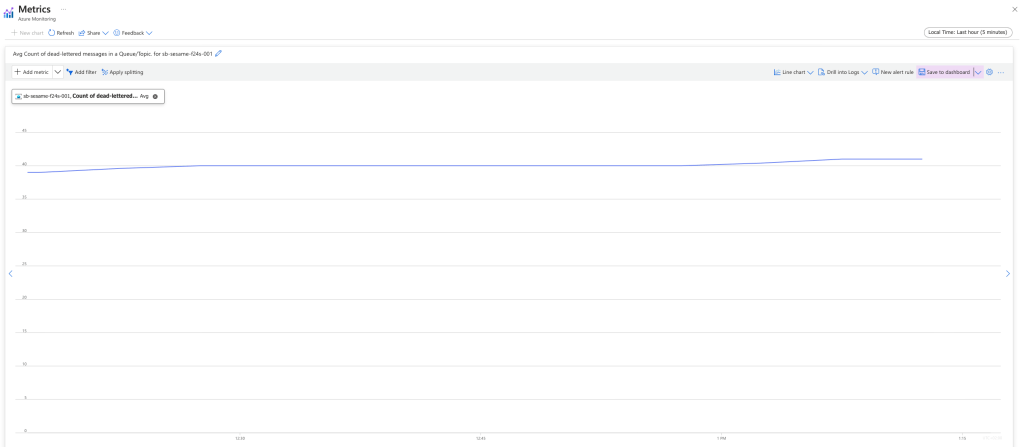
A weird limitation of the Azure Service Bus is the monitoring capabilities. It doesn’t seem to be connected to Log Analytics at all, and the few metrics you can get from Azure Portal are very coarse.
I’m getting a steady stream of dead-lettered messages in my application, and it’s not useful for me setting a boundary as I would need to increase it ever so often, but I do want an alert if the rate of dead-lettered messages accelerates. How would I do that?
First you need to get the metrics into Log Analytics so that you can run queries and projections on it. One way to do this is to create an Azure Function that will check your metrics at intervals and write them to Application Insights. Here’s an example.
public class TimerServiceBusMonitorFunction
{
    private readonly ILogger _logger;
    private readonly TelemetryClient _telemetryClient;
    private readonly ServiceBusAdministrationClient _serviceBusAdministrationClient;

    public TimerServiceBusMonitorFunction(ILogger<TimerServiceBusMonitorFunction> logger, TelemetryClient telemetryClient, ServiceBusAdministrationClient serviceBusAdministrationClient)
    {
        _logger = logger;
        _telemetryClient = telemetryClient;
        _serviceBusAdministrationClient = serviceBusAdministrationClient;
    }

    [Function("TimerServiceBusMonitor")]
    // trigger every minute
    public async Task Run([TimerTrigger("0 */1 * * * *")] object timerDeadLettersMonitor,
        CancellationToken cancellationToken = default
        )
    {
        _logger.LogInformation("START TimerServiceBusMonitor");

        // get all topics
        var topics = _serviceBusAdministrationClient.GetTopicsAsync(cancellationToken);

        await foreach (var topic in topics)
        {
            _logger.LogDebug("Get subscriptions for topic {topic}", topic.Name);

            // get the subscriptions
            var subscriptionsProperties = _serviceBusAdministrationClient.GetSubscriptionsRuntimePropertiesAsync(topic.Name, cancellationToken);

            await foreach (var subscriptionProperties in subscriptionsProperties)
            {
                _logger.LogDebug("Report metrics for subscription {subscription}", subscriptionProperties.SubscriptionName);

                _telemetryClient.TrackMetric("Mgmt.ServiceBus.DeadLetters", subscriptionProperties.DeadLetterMessageCount, new Dictionary<string, string> {
                    { "Topic", topic.Name },
                    { "Subscription", subscriptionProperties.SubscriptionName }
                });

                _telemetryClient.TrackMetric("Mgmt.ServiceBus.ActiveMessageCount", subscriptionProperties.ActiveMessageCount, new Dictionary<string, string> {
                    { "Topic", topic.Name },
                    { "Subscription", subscriptionProperties.SubscriptionName }
                });

                _telemetryClient.TrackMetric("Mgmt.ServiceBus.TotalMessageCount", subscriptionProperties.TotalMessageCount, new Dictionary<string, string> {
                    { "Topic", topic.Name },
                    { "Subscription", subscriptionProperties.SubscriptionName }
                });
            }
        }

        _logger.LogInformation("STOP TimerServiceBusMonitor");
    }
}
This function has a dependency to ServiceBusAdministrationClient which I setup in my Program.cs like this.
var host = new HostBuilder()
    .ConfigureFunctionsWorkerDefaults()
    .ConfigureServices(services => {
        services.AddAzureClients(cfg => {

            // get name of the service bus from environment variable
            var serviceBusName = Environment.GetEnvironmentVariable("SERVICE_BUS_NAME")
                ?? throw new InvalidOperationException("Missing configuration SERVICE_BUS_NAME required.");

            // get the user identity client id from environment variable, if it is not set, use the default azure credential
            var userIdentityClientID = Environment.GetEnvironmentVariable("SERVICE_BUS_USER_MANAGED_IDENTITY_ID");

            // add service bus administration client
            cfg.AddServiceBusAdministrationClientWithNamespace($"{serviceBusName}.servicebus.windows.net")
                .WithCredential(string.IsNullOrEmpty(userIdentityClientID) ? new DefaultAzureCredential() : new ManagedIdentityCredential(userIdentityClientID));
        });
    })
    .Build();

host.Run();
Once deployed to your environment this function will start tracking the metrics of your service bus every minute. In order to get how many dead letters are created every 5 minutes, I have written the following Kusto query.
customMetrics
| where name == 'Mgmt.ServiceBus.DeadLetters'
| extend Subscription = tostring(customDimensions.Subscription)
| extend Topic = tostring(customDimensions.Topic)
| order by timestamp asc
| summarize StartValue = min(value),
            EndValue = max(value) by Topic, Subscription, bin(timestamp, 10m)
| extend AverageRateOfChange = (EndValue - StartValue)
| project Subscription, timestamp, AverageRateOfChange
With this I get the following graph, and the ability to set an alert if the application generates dead letters above my threshold.

